
6 tools to create attractive and quality infographics
Read Time:10 Minute, 9 Second
A beautiful presentation is the key to ensuring that your content attracts more attention. Whether it is on the company website, personal blog, social networks or business meetings: the important thing is that you do not present information solely in text form. Rather, you should use infographics: in this way you will give more value to your content not only from an aspect point of view, but also from logic, because with such a system you are able to summarize for your listeners or web site visitors. Clear and comprehensible way all the complex logical connections.
Providing visual information prepared in order gives you the opportunity to communicate in the best way concepts, results and offers to colleagues, customers and users of the network. Turning data into visual paths will lighten the weight and give your presentations a little color. Infographics are particularly appreciated by users, especially for the following reasons …
- Usually image information can be processed faster than particularly long text passages.
- The illustrations support textual content highlighting the most important information.
- The graphics are ideal to be shared on social networks.
- The images serve to give color to blocks of otherwise rather monotonous text.
- Information graphics are an important element of online marketing (such as enhancing SEO content on landing pages, blogs or social media).

Infographics are therefore useful and sensible not only because they are able to transmit information to the observer very quickly but also because they are able to make a big contribution to the search engine optimization of your web content. In fact, through them, you increase the range of your online presence through clicks, likes and shares, increasing in addition the chances that the rate of conversions will increase. S By creating your own infographics without the help of an expert, you can decide which of your content to highlight and how to organize them on a thematic level.
6 Programs to create infographics
The network is full of software with which you can create custom infographics. To provide you with an initial orientation, we present six programs in which at least the basic functions can be used free of charge. In addition we explain the advantages and disadvantages of the individual tools and compare the features already available in free versions and what additional possibilities are offered by the premium versions of the tools taken into consideration.
1# Infogr.am: Make infographics and monitor data easily

With the free infogr.am tool, even inexperienced users are able to create infographics online without major difficulties and without the need to install additional software. Specifically, infogr.am provides a simple and practical first approach to users who have no experience with graphics programs: after registering, naturally free, you have a tidy user interface and an easy-to-use menu.
Through the side navigation panel the registered user has the possibility either to create a personal infographics from scratch or alternatively to rely on pre-set templates. Subsequently the user can directly add contents such as texts, diagrams (pie, dot, bar, pictograms and so on), geographical maps, images or videos. Infogr.am offers a multitude of templates for a clear and tidy display.
With infogr.am the use of ready-made models and settings is done in a simple and intuitive way. Data can be processed within cell structures as is already the case in other Excel spreadsheet programs. If you have a table ready, then you can import it into the program in one of the classic supported formats, such as .xls, .xlsx and .csv, with the help of Google Drive, Dropbox, OneDrive or otherwise via URL as a JSON feed ( JavaScript Object Notation). You can easily add and delete elements (diagrams, maps, texts, images, videos and other data) with the drag and drop function via the sidebar of the editor.
If you create an infographic with infogr.am, you can share it with other users and then integrate it on your website. However, once completed, the projects cannot be downloaded but can only be published online on the software page; alternatively shared via the URL. Premium functions such as verification and control through analysis functions (with measurement of performance according to geographical location and various advice), export in PDF or PNG format, extended geographical maps, unlimited icons, greater data volume, links on data, table comparison, group access and offline sharing are only part of the paid monthly subscription with Pro, Business or Enterprise rates.
Overall Evaluation
With a few clicks, the free tool allows you to design clear infographics. As for the possibilities of structuring infogr.am is perhaps not equipped with a great variety as are other tools, but those who want to create infographics with few values in a simple and fast and then publish them online is infogr.am the web service ideal.
2# Easel.ly: Create engaging infographics intuitively
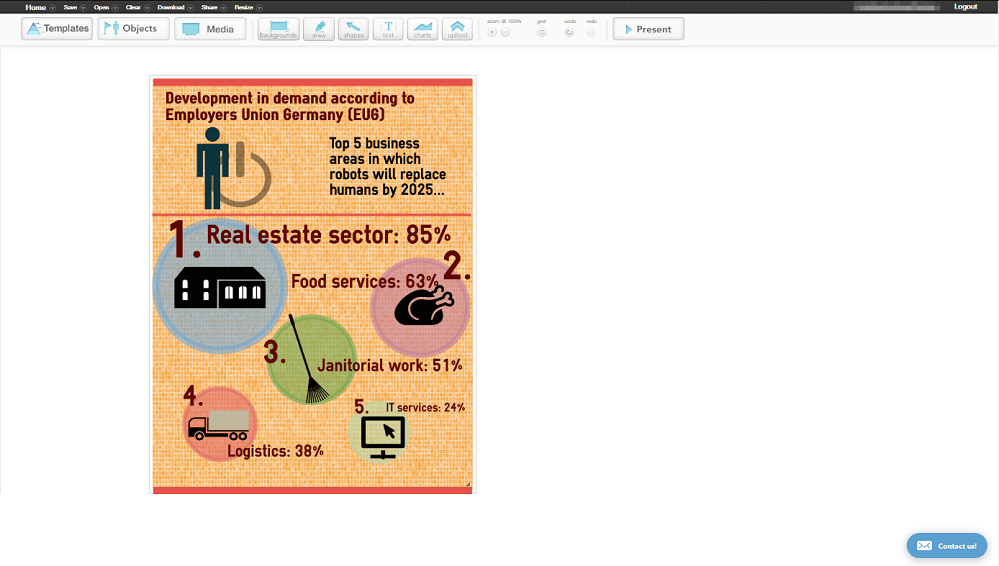
With the easel.ly tool you can generate aesthetically pleasing infographics on numerous topics in a simple and freeway. The templates, objects, media and icons contained in the free basic version allow a fair variety of creative designs. Here, too, you will find a reduced and ordered menu bar to help you integrate ready-made templates, icons, images and videos in the graphic you are working on in a simple and direct way.
Thanks to the drag & drop you can insert and move elements within the graphics; moreover there is the possibility to choose a background to taste. Through an additional sharing button you can integrate your infographics on the websites by means of a code or send them by e-mail in the form of links; otherwise you can share it and process it together with other people. In this way, easel.ly proves to be particularly appropriate for the spread of infographics via social networks (Facebook, Twitter), URLs or external code.
However, what is missing from easel.ly is the function of importing CSV files from spreadsheet management programs: if you have a wide range of numeric values, you have to enter them manually, which in some cases may require excessive effort. In addition, the variety of ready models of the free version of easel.ly is significantly reduced. With the paid subscription of the Pro account you have 680,000 different tool icons to generate thematic infographics (for example in the business or technical field). In addition to this there are also customer care, other fonts, upload options (fonts and custom graphics) as well as additional privacy settings. Even the download of PDF in high resolution is only possible in paid mode.
Overall Evaluation
If you are looking for an easy-to-use infographics tool and where design features are not reduced to the bone, you can go wild with the easel.ly online tool.
3# Venngage: Create attractive infographics without having to give up data processing
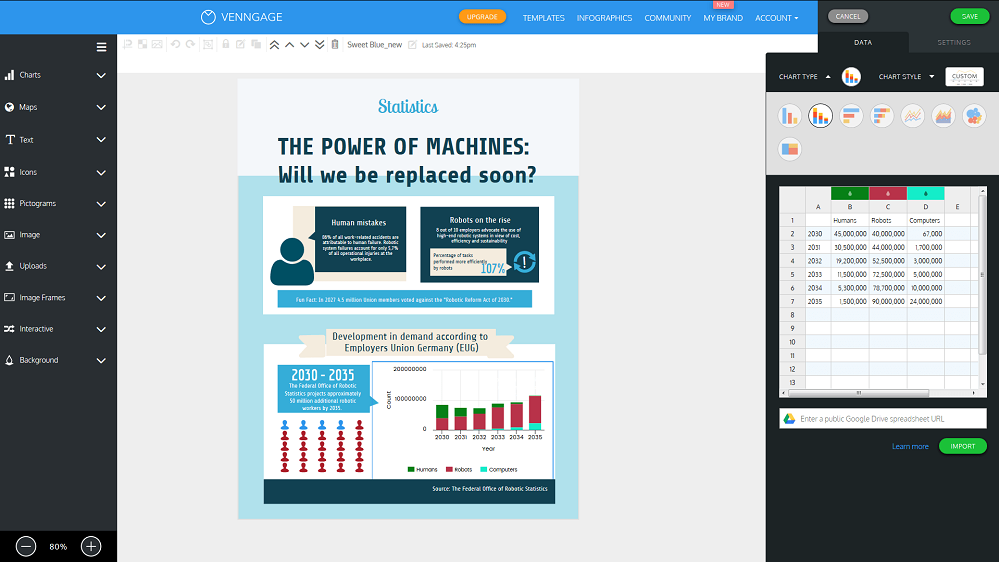
With the versatile Venngage infographic generator you have a variety of creative possibilities for your information design projects. Already in the free version for students the tool contains multiple templates ready to use original infographics and templates, suitable for different purposes: surveys, posters, flyers, advertising actions and content for social media. In this way it adapts optimally to creative and web-like users who want to create diagrams that are visually suited to their needs.
It is true that in the basic package it is not easy to find the elements that can be used for free, but thanks to a clear interface you can generate engaging graphics in no time and complete them with your media (such as with the integration of YouTube videos).
Unlike infogr.am and easel.ly, Venngage offers the advantage that you can import datasets from tables via Google Drive and conveniently organize and process individual color, text and image elements via drag & drop. The result is then directly shared through the URL of the Venngage community page or on the social networks Facebook, Pinterest, Twitter and LinkedIn. Anyone wishing to further exploit the functionality of the program, which is already well supplied in its free version, can proceed with the upgrade of their account so as to be able to draw even more templates, customize them, use customer support, export their projects into files High resolution PNG format, export and save interactive or vector PDFs and manage shared accounts.
Overall Evaluation
Venngage is an optimal free tool for creative users who want to create infographics in their own hands and who need to process data and figures.
4# Canva: Create large infographics
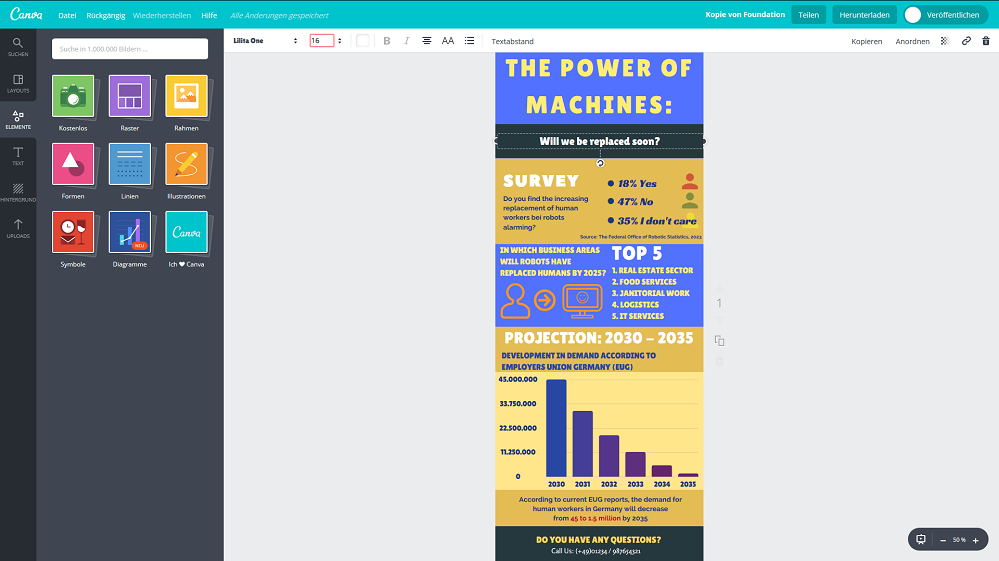
The Canva graphic design tool offers a particularly rich user interface in Italian. Although it is more focused on a visual type that is visually appealing rather than data processing, it nevertheless manages to impress thanks to its incredible variety of beautiful and practical templates: for example, projects such as post for social media, office documents (to-do lists, ready-to-write templates, etc.) blogs, e-mails, events and advertisements. Infographics (resolution: 800 x 2000 px) can be created easily and intuitively using the drag & drop function. The great advantage is that all the functions of the tool are free: you only pay for the additional icons.
Canva is especially recommended for creative and curious people to experiment. The color tones and symbols used are saved in the history and are therefore quickly traceable. Moreover, there is the possibility to load some images in a simple way and to process them with photo filters. The big advantage: unlike other free online tools, Canva allows you to save your projects in JPG, PNG or PDF format (printable). In addition to this you can post your graphics directly on Facebook or Twitter or send them via e-mail.
Overall Evaluation
Those who enjoy creativity and are not scared by the variety of functions, using the rich database and the download option of the program can generate infographics worthy of note.
5# Piktochart: Generate and save infographics with data series
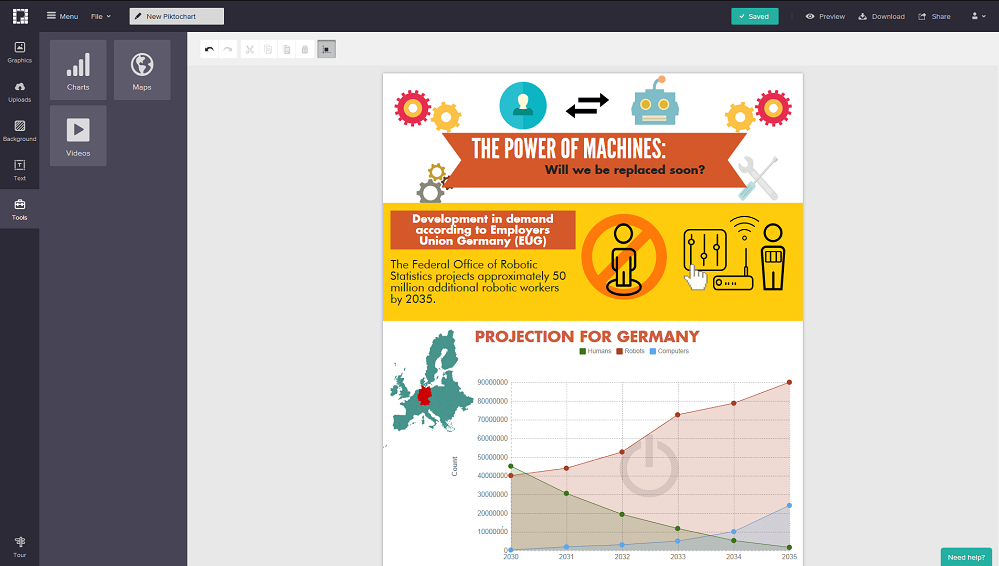
With the Piktochart visualization tool, you can not only create infographics, but you can also create presentations and documents for printing. The tool is practical because the free account also includes uploading photos as well as downloading and sharing graphics in JPG or PNG format. Projects can be shared via Facebook, Twitter, Google, Pinterest, exported to the Evernote planning tool or integrated as a code. Finally it is also possible to import data from the tables.
Who does not disdain to have some additional function (such as the expanded upload of photos, the download in quality suitable for printing, export to PDF and transfer to SlideShare and LinkedIn as well as a password protection), then will have to resort to their paid packages.
Piktochart has two drawbacks: the first is that even for free registration personal data such as name, company or school, age and activity are requested. The second and perhaps more intrusive is that on every project created with the free subscription appears the logo of the software.
Overall Evaluation
With Piktochart you can create, save and export custom infographics, the only flaw is that the logo is present on the final products.
6# Visme: For multifunctional infographics

Visme is a multifunctional design tool with which you can create infographics and then export them in JPGformat, all for free. Similar to other processing programs on the market, Visme offers personalized access to individual elements (texts, images, diagrams, symbols, etc.) with a level view: by clicking on the image element the indication appears where it is located. Wanting these elements can also be moved to the first or second floor, or be made transparent. The practical auto save function and the chronology that records the elements of the image used further lighten the work.
However, the use of Visme hides some flaws: the basic drag & drop feature is so comfortable, but it becomes unmanageable when you want to select multiple overlapping elements. In addition, in the preview mode the proportions are not correctly displayed at 100%. Finally, even the processing of individual levels can be complicated for the less experienced.
Overall Evaluation
With Visme you can make high quality infographics at the price of some difficulty in using it.

Average Rating